Dan HalesinThe StartupMatrix Operations in Java: DeterminantsComputing the determinant of a square matrix recursively7 min read·Nov 1, 2020----
Dan HalesinThe StartupMatrix Multiplication Made Easy (In Java)Spoiler alert: It’s just a bunch of dot products5 min read·Oct 26, 2020----
Dan HalesinThe StartupProgramming Linear Algebra in Java: Vector OperationsA look at Java through the lens of a simple Vector class10 min read·Oct 19, 2020----
Dan HalesMake Your Own Toy Data SetIt might be a “toy,” but building it is a serious project.4 min read·Oct 10, 2020----
Dan HalesinTowards Data ScienceRewiring Your Brain from Python to JavaSeven conceptual hurdles you might face when learning a new programming language12 min read·Sep 24, 2020--2--2
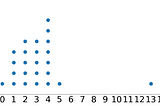
Dan HalesinPython in Plain EnglishA Simple Dot Plot Function in PythonAn easy-to-use tool for AP Statistics teachers5 min read·Sep 14, 2020----
Dan HalesinTowards Data ScienceThe Sardinas-Patterson Algorithm in Simple PythonChecking for Unique Decodability in Variable-Length Codes8 min read·Jul 30, 2020----
Dan HalesinLevel Up CodingJust F***ing Google It.How to take this advice.12 min read·Jul 18, 2020----
Dan HalesinTowards Data ScienceDoing Your Statistics Homework With Python, Part 1Analyzing Categorical Data8 min read·Jul 13, 2020----
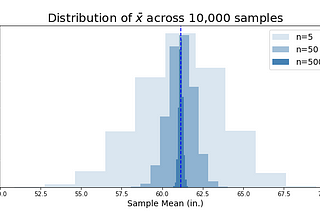
Dan HalesinPython in Plain EnglishMaking Sense of Sampling DistributionsWhen a shiny new student of data science or statistics first wanders into the land of hypothesis testing, one of the first conceptual…7 min read·Jun 29, 2020----